Chasing 200 Tokens per Second on a MacBook (and Why the Fast Model Lost)
I watched a video with a title built to make me click: “Qwen 3.8 27B Just Hit 200 Token/s on Mac M5 (Lithos Metal)”. I have an M5 Max. I also have an agent that runs on a local model all day: it does game art and Blender work for a side project, and its “brain” is a model sitting in my laptop’s memory, not an API I pay for by the token. Anything that makes that brain faster is something I want.
So I did what you do. I installed the thing, ran some numbers, and expected a nice “here is how to get 200 tokens per second” post.
That is not the post you are reading. What I ended up with is a day of measurements that taught me more about how local models actually spend their time than anything I have read about it, and a result I did not see coming: the fastest model I tested could not do the job at all, and the model I had rejected a week earlier for being too slow ended up being both the correct one and the fastest one, once it ran on the right engine.
This is a long one. Grab a coffee.
Where I started
The agent runs inside a Linux VM on my MacBook Pro (M5 Max, 40-core GPU, 128 GB of memory). A VM cannot use the Mac’s GPU, so a small service on the Mac itself serves the models and the VM talks to it over the VM’s private network. The agent itself is opencode, doing multi-step work: write a Blender script, run it, look at what came out, fix it, report.
Its brain was qwen3-coder 30B running on Ollama. A week earlier I had tried Qwen3.8 27B for the same job and written this note in the config:
careful and correct, but 11 to 15 tokens/s: three steps in ten minutes, then out of time.
So I already knew the slow model was the better thinker. I had picked the fast one anyway because an agent that never finishes is not an agent. The video promised to make that trade go away.
A crash course in why local models are slow
Before the numbers, it helps to know what “tokens per second” actually measures, because it is really two different numbers, and they are limited by completely different things.
Two numbers, not one
When you send a prompt to a model, it does two jobs:
- Prefill: read the whole prompt. Every token of it goes through the model once, but all at the same time, in big batches. This is limited by raw compute: how many multiply-adds per second the GPU can do. You feel it as time to first token (TTFT): the pause before anything appears.
- Decode: write the answer, one token at a time. Each new token needs a full pass through the model, and you cannot start token 50 until token 49 exists. This is limited by memory bandwidth: how fast the chip can stream the model’s weights out of memory.
For a chat question with a short prompt, prefill takes a fraction of a second and decode is everything. For an agent, it is the other way around. My agent’s prompts are tens of thousands of tokens: the instructions, the tool definitions, the files it has read, the conversation so far. So both numbers matter, and the one the video was about (decode speed) is only half the story.
Here is how I measured them. My benchmark streams a chat completion and records two timestamps:
t0 = time.time()
for chunk in stream:              # server-sent events from /v1/chat/completions
    if chunk_has_text and first is None:
        first = time.time()       # first token arrived
end = time.time()

ttft   = first - t0                         # prefill (plus a little overhead)
decode = completion_tokens / (end - first)  # tokens per second while writing
completion_tokens comes from the server’s own usage report, so it counts real tokens, not chunks.
The memory bandwidth ceiling
Decode is the easy one to reason about. To produce one token, the chip has to read every weight the model uses for that token. So:
max tokens/s ≈ memory bandwidth ÷ bytes read per token
The M5 Max has 614 GB/s of memory bandwidth (the M5 Pro has 460, the base M5 307, per Apple’s spec sheet). A model’s size on disk is roughly what gets read per token:
| model | size at 4-bit | ceiling at 614 GB/s |
|---|---|---|
| Qwen3.8 27B (dense) | ~17 GB | ~36 tokens/s |
| qwen3-coder 30B (MoE, 3B active) | ~2 GB read per token | ~300 tokens/s |
That ceiling is a rough upper bound: real engines lose time to everything else a model does besides reading weights. But it explains a lot. When Ollama ran Qwen3.8 at 13 to 15 tokens/s, it was not broken. It was at about 40% of what physics allows for that model on this chip.
Dense vs. Mixture of Experts
Those two rows are so different because the models are built differently.
A dense model uses every weight for every token. Qwen3.8 27B has 27 billion parameters and reads all of them, every token.
A Mixture-of-Experts (MoE) model is split into many small “expert” sub-networks plus a router that picks a few of them for each token. qwen3-coder 30B has 30 billion parameters in total, but only about 3 billion are active for any given token. You pay the memory cost of all 30 billion (they must all be loaded, because any token might need any expert), but only the bandwidth cost of 3 billion. That is why it writes so fast.
The catch, which is what this whole post ends up being about: fewer active parameters per token can also mean less thinking per token.
Quantization, in one paragraph
“4-bit” means each weight is stored in 4 bits instead of the 16 it was trained in. The model shrinks about 4×, so it fits in memory and reads 4× faster, at a small cost in quality. Every model in this post is 4-bit in some flavour: GGUF Q4_K_M on Ollama, MLX 4-bit, or NVIDIA’s NVFP4 format on lithos-metal. They are not identical, so treat cross-engine comparisons as “same model, roughly the same size”, not “bit-for-bit the same”.
What lithos-metal actually does
lithos-metal is an open-source inference engine for Apple Silicon. Two ideas carry it:
Megakernels. A normal engine runs a model layer as a sequence of separate GPU programs (“kernels”): one for attention, one for normalization, one for each matrix multiply. Each launch has overhead, and intermediate results bounce through memory between them. lithos fuses big chunks of a layer into a single generated Metal kernel, so the GPU does more work per launch and less shuffling.
Speculative decoding with DSpark. This is the trick that lets it go past the bandwidth ceiling. A tiny “draft” model guesses the next several tokens cheaply. The big model then checks all those guesses in one pass: one read of its weights, several positions verified at once. Every correct guess is a token you got without paying for its own weight read. lithos’s DSpark head proposes seven tokens per round and verifies them together with one anchor token.
DSpark comes from a DeepSeek paper (July 2026). It reports a 60 to 85% speedup per user over a one-token draft baseline, measured in a datacenter serving real traffic. That is a big deal, but notice what it is not: it is not 10×, and it only speeds up decode. Reading the prompt (prefill) gets nothing from it.
And the “200 tokens per second” in the video title? The lithos blog post describes more than 200 per user as a peak, and its own steadier figures are projections: about 168 tokens/s at a 128-token context and 127 at 32K, roughly 1.8 to 2× MLX and Ollama on short prompts. How often the draft guesses right depends on what is being written: predictable text (code, boilerplate) gets more accepted guesses than free-flowing prose.
So going in, my realistic expectation was “maybe 2×, more on code, nothing on long prompts”. That turned out to be about right, and still very much worth it.
How I tested
I wanted two kinds of evidence: raw speed, and whether the model can actually do the agent’s job. Speed without the second is how I ended up with qwen3-coder in the first place.
The speed test
Three prompts, two runs each, temperature 0, through each engine’s OpenAI-compatible endpoint:
- code: write a GDScript tower class for a tower defense game,
- prose: explain tower cost vs. damage balancing in about 400 words,
- long: about 27,000 tokens of real game source code, followed by a question about it. This is the one that looks like an agent’s prompt.
The second run of each matters: it shows whether the engine reuses work from an identical prompt it has just seen.
The agent test
A five-step task in Blender, run by opencode with no plugins, a 15-minute limit, and a shell allowlist (it can run Blender and a few read-only commands; it writes files with its own file tool):
- Write
tower.py: an 8-sided cylinder (radius 1, depth 2) whose bottom sits at z=0, an 8-sided cone (radius 1.2, depth 1) whose base sits at z=2, a glowing cyan material on the cone, join them into one object namedTower, export it toout/tower.glb. - Run it.
- Write
check.py: import the file and print each mesh’s name, triangle count and height. - Run it.
- Write
report.mdwith those three values.
Then a separate script of mine, running in Blender, checks the result against the actual file: one mesh, height 3.0, sitting on z=0, a glowing material, and a report whose numbers match the real mesh. A model that writes a nice report about a tower it never built fails.
Before trusting the checker, I fed it a reference solution I wrote by hand. It failed my correct solution. The bug: abs(min_z or 9) < 0.05, which treats a bottom at exactly 0.0 as “missing”, because zero is falsy in Python. A checker that cannot pass the right answer measures nothing. Fixed, the reference passed and a deliberately wrong report failed, and only then did I start believing it.
Everything that went wrong first
I want to be honest about this part, because each mistake changed the numbers, and some of them would have produced a confidently wrong post.
- My Blender wrapper broke Blender. I put Blender on the agent’s
PATHwith a symlink, and Blender could not find its own bundled Python through it. qwen3-coder’s response to Blender failing is in the next section, and it is not great. - My own agent was using the GPU. The game-art agent kept running its normal work during the first rounds. Several numbers were measured while it was loading its own model and rendering in Blender on the same chip. One MLX run swung between 4.6 and 31 tokens/s on the same prompt. I paused the agent and re-ran everything that had overlapped with it.
- Another app was eating CPU. An inference app I had stopped using was sitting at 110% CPU in the background. I removed it entirely (and the 280 GB of models it had downloaded).
- I raced myself. My cleanup script used
pkill -fto stop servers between runs, and it matched the command line of my own queued job. It killed only the job’s parent shell, so the job survived, and when I queued it again, two copies ran at once. Two servers, one GPU, and a pile of429 Too Many Requests. Those numbers went in the bin. - “More batching” made Ollama slower. Raising Ollama’s
num_batchfrom 512 to 2048, which you will see recommended, took the long prompt from 60 s to 102 s before the first token, and stopped it reusing an identical prompt (11 s instead of 0.1 s). - The Homebrew release was behind.
brew installgave me lithos 0.1.2 from October 5. The fixes to its prompt processing (prefill) landed after that, two of them merged on October 11. I builtmainfrom source and compared both. - Power mode. Most runs used macOS’s default Automatic power mode. Partway through I switched to High Power (on the adapter), so I re-ran the winning setup under it to see the difference on its own.
The results
All numbers below are from runs with nothing else on the GPU. “Automatic” and “High” are the macOS power mode.
Speed
| model, engine | power | code tok/s | prose tok/s | 27K-token prompt: wait / then writes |
|---|---|---|---|---|
| Qwen3.8 27B, lithos (main) | High | 88–91 | 53–58 | 48–88 s / 25–34 |
| Qwen3.8 27B, lithos (main) | Auto | 82–88 | 52–54 | 47–94 s / 16–33 |
| Qwen3.8 27B, lithos 0.1.2 | Auto | 83–89 | 48–52 | 92–165 s / 17–18 |
| Qwen3.6 35B-A3B (MoE), lithos | Auto | 146–159 | 78–81 | 122–134 s / 40–44 |
| Qwen3.8 27B, Ollama | Auto | 13–15 | 11–13 | 146 s / 15 |
| Qwen3.8 27B, MLX | Auto | 21 | 18–20 | 82 s / 14–15 |
| qwen3-coder 30B (MoE), Ollama | Auto | 76–78 | 74–77 | 53 s / 30–34 |
| qwen3-coder 30B (MoE), MLX | High | 120–122 | 121–122 | 22 s / 40–42 |
A few things jump out.
The headline is real, just not 200. The same Qwen3.8 27B goes from 13–15 tokens/s on Ollama to 82–91 on lithos, about 6×. That is far past the ~36 tokens/s bandwidth ceiling I calculated above, which is exactly what speculative decoding is supposed to do. The MoE model on lithos got to 146–159 on code. I never saw 200, but this is the jump that makes Qwen3.8 usable.
Code beats prose, as DSpark predicts: 82–91 on code against 52–58 on prose with the same model and engine. Code is more predictable, so more draft guesses are accepted.
Long prompts take the shine off. At 27,000 tokens of context, Qwen3.8 on lithos writes at 16–34 tokens/s, and it spends 47 to 94 seconds reading the prompt first. Speculative decoding does nothing for that reading. And on prefill specifically, MLX was the clear winner: qwen3-coder read the same 27K prompt in 22 seconds on MLX, about 1,200 tokens per second.
MLX vs. Ollama depends on the model. For qwen3-coder, MLX was about 1.6× faster than Ollama (121 vs. 77 tokens/s), which matches what I found running Claude Code against a local MLX model earlier this year. For Qwen3.8, MLX was slower than lithos by 4×. The engine that is best for one model is not automatically the best for another.
The task that actually matters
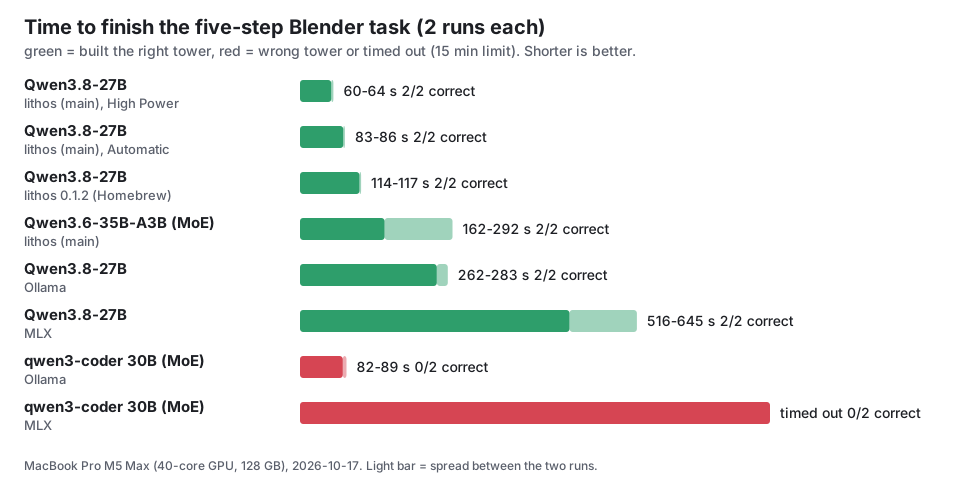
| model, engine | Blender task (2 runs) |
|---|---|
| Qwen3.8 27B, lithos (main), High Power | 2/2 correct, 60–64 s |
| Qwen3.8 27B, lithos (main), Automatic | 2/2 correct, 83–86 s |
| Qwen3.8 27B, lithos 0.1.2 | 2/2 correct, 114–117 s |
| Qwen3.6 35B-A3B (MoE), lithos | 2/2 correct, 162–292 s |
| Qwen3.8 27B, Ollama | 2/2 correct, 262–283 s |
| Qwen3.8 27B, MLX | 2/2 correct, 516–645 s |
| qwen3-coder 30B, Ollama | 0/2 |
| qwen3-coder 30B, MLX | 0/2 (both timed out) |
Across every run I did that day, including the ones I threw away for being contaminated, qwen3-coder attempted this task nine times and never once built the right tower. Qwen3.8 got it right every time it finished, on every engine. The only thing the engine changed was how long it took: from ten minutes on MLX down to one minute on lithos.
The MoE model on lithos is the interesting middle case. It writes twice as fast as Qwen3.8, and it was correct, but it took 2 to 5 times longer to finish the task. Fast tokens do not make a fast agent if the agent needs more of them, or more turns, to get there.
Why the fast model could not build a tower
This is the part I find most interesting, so let’s look at what each model actually wrote. Here is the line that matters:
# qwen3-coder (both clean runs)                  # Qwen3.8
bpy.ops.mesh.primitive_cylinder_add(             bpy.ops.mesh.primitive_cylinder_add(
    vertices=8, radius=1, depth=2,                   vertices=8, radius=1, depth=2,
    location=(0, 0, 0))                              location=(0, 0, 1))      # 0 + 2/2
bpy.ops.mesh.primitive_cone_add(                 bpy.ops.mesh.primitive_cone_add(
    vertices=8, radius1=1.2, depth=1,                vertices=8, radius1=1.2, depth=1,
    location=(0, 0, 2))                              location=(0, 0, 2.5))    # 2 + 1/2
Blender places a new cylinder or cone by its centre. The task gave positions for the bottom of each shape. qwen3-coder copied the numbers from the prompt straight into location, so its cylinder runs from -1 to 1 and its cone floats from 1.5 to 2.5: a tower that sinks through the floor with a gap under its roof. Qwen3.8 did the one extra step, “centre = bottom + half the height”, every single time.
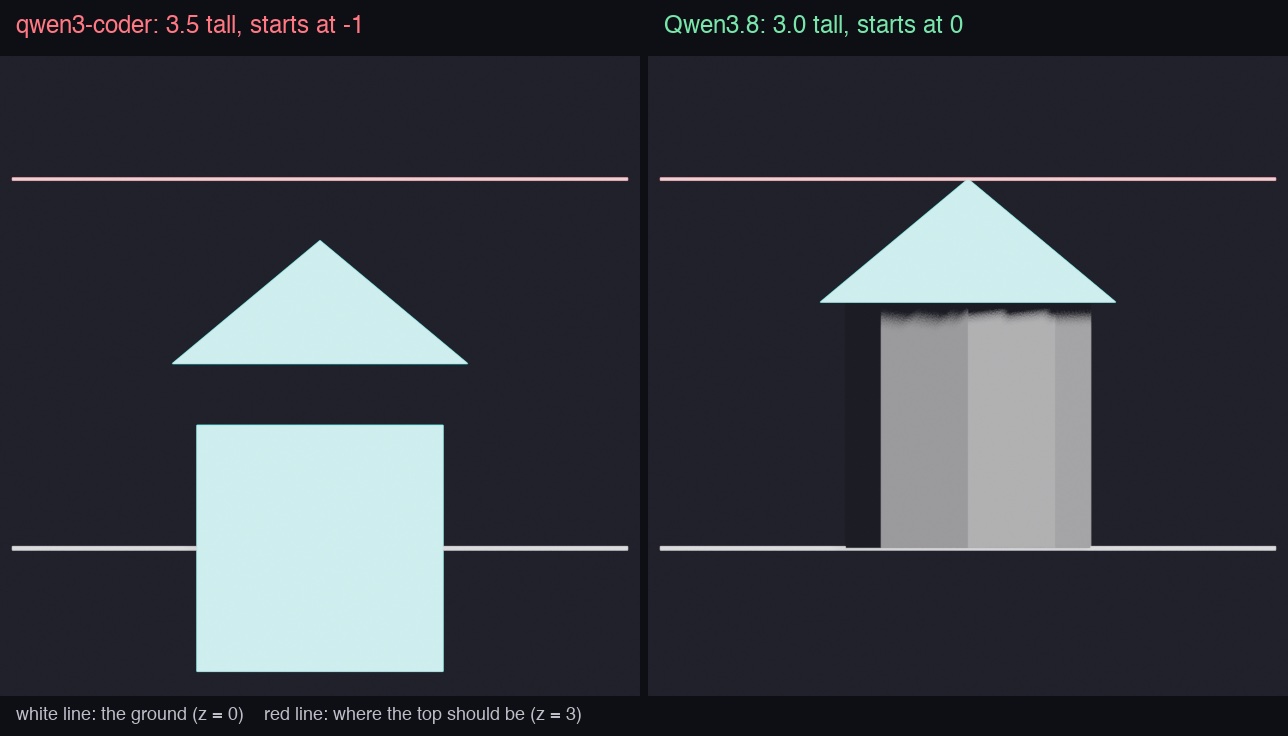
The material code, by comparison, was essentially identical between the two. Both knew the Blender API fine. The difference was spatial reasoning: turning “the bottom sits at zero” into a centre position.
The second difference is worse. qwen3-coder’s own check.py printed height: 3.50. The task describes a 2-unit cylinder and a 1-unit cone. It wrote, in its own words, “The script found the Tower object with 42 triangles and height of 3.50”, put 3.50 in the report and finished. It reported the number honestly; it just never asked whether the number made sense.
And in the very first run, when my broken symlink stopped Blender from running at all, qwen3-coder wrote report.md anyway, with “expected” values and no model file anywhere. That one is the reason my checker compares the report against the real file.
On MLX it failed differently again. Its code contained doubled tokens, export_scene.gglTF2, out/ttower.glb, primitive_concone_add, which never appeared with the same model on Ollama. Then it got stuck trying a blocked shell command 102 times instead of using the file tool it had. My guess is the MLX 4-bit build or how mlx_lm.server streams tool calls, rather than the model itself, but I did not dig further.
The pattern fits the architecture. qwen3-coder is an MoE model tuned to produce code quickly, and it is genuinely good at producing correct API calls. Qwen3.8 is a dense, general reasoning model that thinks before it writes. That makes it slower per token, and it is exactly the extra thinking that catches “bottom vs. centre” and “3.5 is not 3”.
Caching: the hidden variable
The “second run” numbers revealed something I did not expect: the three engines handle repeated prompts very differently.
- Ollama keeps the last prompt’s processed state while the model stays loaded. The identical 27K prompt went from 53 seconds to 0.09 on the second run. (By default it unloads a model after 5 idle minutes, and the cache goes with it.)
- MLX (
mlx_lm.server) also has a prompt cache: 82 seconds to 0.26. - lithos reused nothing on my long-prompt test. 47 seconds, then 94.
At first that looked like a big strike against lithos. Then I read its serving design notes: lithos saves “prefix checkpoints” only at message boundaries (system prompt, tool definitions, earlier turns), never in the middle of one message. My long test is a single 27K-token user message, so there is nowhere to save. It is lithos’s worst case.
An agent conversation is nothing but message boundaries. And in the agent runs, lithos’s log shows it restoring about 12,000 cached tokens on each turn and only processing what was new. That is why its task times are so good despite its long-prompt numbers looking mediocre. My benchmark was measuring a shape of prompt my agent never sends.
lithos can also keep those checkpoints on disk with --prefix-cache-dir, so they survive restarts. More on that below.
Does High Power mode matter?
I re-ran the winning setup, Qwen3.8 on lithos main, with everything identical except the power mode:
| Automatic | High Power | |
|---|---|---|
| code | 82–88 tok/s | 88–91 tok/s |
| prose | 52–54 tok/s | 53–58 tok/s |
| 27K prompt | 47 s, then 94 s | 48 s, then 88 s |
| Blender task | 83–86 s | 60–64 s |
Per token, High Power is worth about 5 to 10%. Per task, it was about 25% faster. I do not have a clean explanation for the gap. My guess is that an agent task is many short bursts with pauses in between (Blender running, files being written), and Automatic mode is slower to ramp back up after each pause. The long-prompt swing (47 then 94 seconds) happened in both modes, so that one is lithos, not heat.
What about the image models?
The agent also makes pictures: Z-Image Turbo for quick drafts and Qwen-Image (2512) for finals, both through mflux, the MLX port of these models. Could the same tricks speed those up?
Not directly. These are diffusion models: they start from noise and refine the whole image over a fixed number of steps. There are no tokens to guess ahead, so speculative decoding does not apply, and lithos does not run them anyway.
My first theory was that loading was the problem: each request starts a fresh mflux process that loads the weights and quantizes them on the spot. I measured it, and I was wrong.
| model | per picture (1024×1024) | of which: generation steps |
|---|---|---|
| Z-Image Turbo, 8 steps | 24 s | 18.5 s (2.3 s per step) |
| Qwen-Image, 20 steps | 190 s | 190 s (9.5 s per step) |
Loading costs about 4 to 5 seconds. The time is all in the steps. And Qwen-Image’s steps are expensive for two reasons: it is a 20-billion-parameter model, and it uses classifier-free guidance (CFG), which runs the model twice per step, once with your prompt and once with a “negative” prompt, and blends the two. 20 steps × 2 passes = 40 full passes through a 20B model.
The image-model equivalent of speculative decoding is step distillation: train the model to get to the final picture in a handful of steps instead of 20 to 50. Z-Image Turbo is already one (“Turbo” is the giveaway). For Qwen-Image, the Lightning LoRA from lightx2v does it: 8 or even 4 steps, and no guidance needed. mflux takes it as a LoRA:
mflux-generate-qwen --prompt "..." --width 1024 --height 1024 \
  --steps 4 --guidance 1.0 --quantize 4 \
  --lora-paths Qwen-Image-2512-Lightning-4steps-V1.0-bf16.safetensors --lora-scales 1.0
| setup | per picture |
|---|---|
| Qwen-Image, 20 steps | 186–194 s |
| + Lightning, 8 steps | 88–90 s |
| + Lightning, 4 steps | 52–54 s |
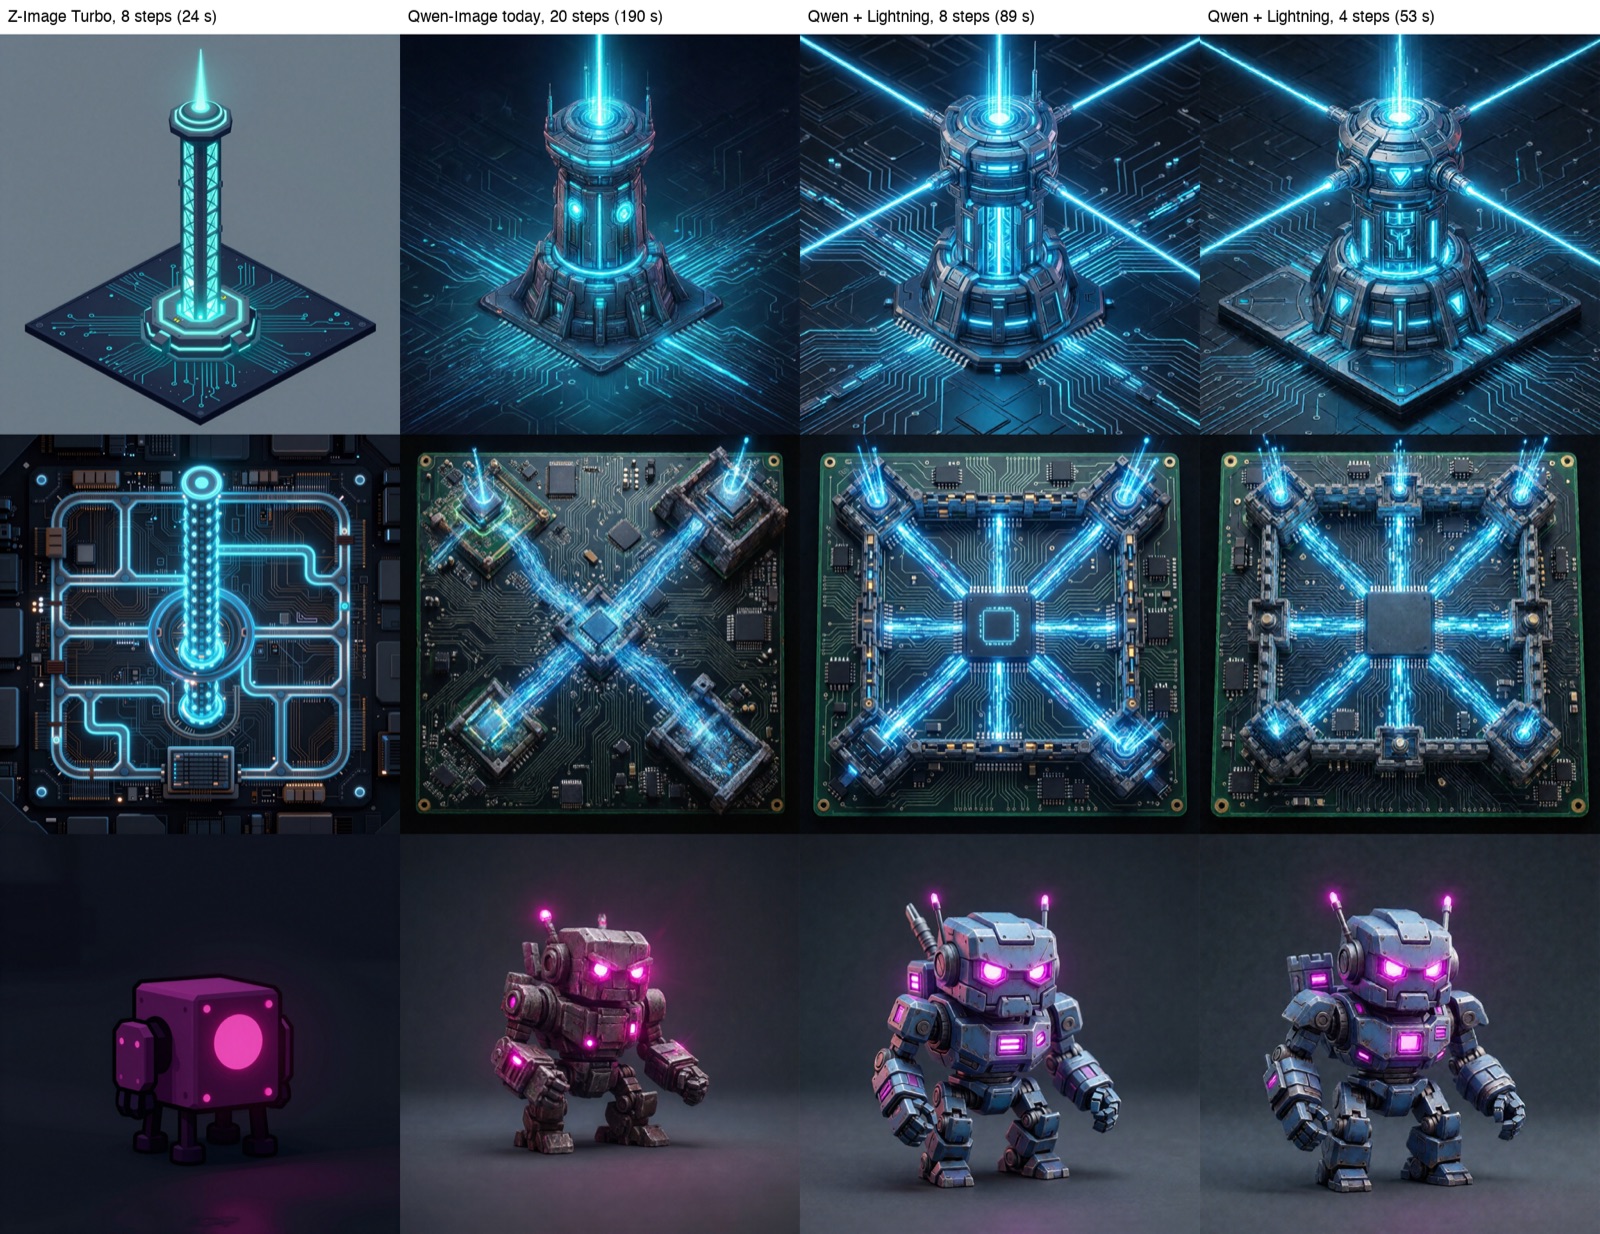
I expected distillation to cost quality. On these three prompts it did not: to my eye, the Lightning pictures are cleaner than the 20-step originals, with crisper edges, stronger neon, and a robot that is not muddy brown. And 4 steps is almost indistinguishable from 8. Your style may differ; look at your own art before you switch.
There is one more speedup sitting on the table. Lightning is meant to run without guidance, but each Lightning step still took 9 seconds, the same as a normal step. So I read mflux’s Qwen-Image code:
noise          = self.transformer(... prompt_embeds ...)
noise_negative = self.transformer(... negative_prompt_embeds ...)   # always runs
guided = noise_negative + guidance * (noise - noise_negative)
At guidance=1.0 that formula is just noise. The second pass is computed and thrown away on every step. Skipping it when guidance is 1.0 should take a 4-step picture from about 53 seconds to about 35. That is an estimate, not a measurement, and it is a small change I want to suggest upstream.
So, did the image models “perform badly”? Not really. They were doing exactly what they were told: 40 passes through a 20-billion-parameter model. The fix was to tell them to do less.
The setup I ended up with
The brain: Qwen3.8 27B on lithos-metal, built from a pinned commit of main (5485ad6), not the Homebrew release:
lithos-metal serve --model nvidia/Qwen3.8-27B-NVFP4 \
  --served-model-name local-brain --max-context 65536 \
  --host 127.0.0.1 --port 8189 \
  --model-ttl 900 \
  --prefix-cache-dir ~/Library/Caches/lithos-prefix --prefix-cache-disk-size 16G
--served-model-namekeeps the old name, so the agent’s config did not change at all.--model-ttl 900hands the model’s GPU memory (about 16 GB plus caches) back after 15 idle minutes, and reloads it on the next request. My laptop is also my laptop.--prefix-cache-dirkeeps the agent’s system-prompt checkpoint on disk, so a reload does not re-read it.
It is pinned because main is not a release. When lithos tags the next version, I will test it the same way before moving.
One wiring detail: lithos runs one generation at a time and turns a second request away with 429. My little service in front of it now queues chat requests instead of passing the 429 to the agent.
Final images: Qwen-Image with the 4-step Lightning LoRA. Drafts: Z-Image Turbo, unchanged.
Memory: Ollama now holds no chat model at all, only the small vision model the agent uses to describe its pictures, loaded on demand. I deleted every model my agents do not use. Between old MLX experiments, the test models and that abandoned inference app, that was close to 400 GB.
What I took away from it
Measure the job, not the engine. If I had stopped at tokens per second, I would have picked qwen3-coder on MLX: 121 tokens/s, the fastest prompt reading of the lot. It failed every attempt at the actual task. The checker, and the hand-written reference solution that proved the checker worked, did more for this decision than any speed number.
“Fast” has two halves. Decode speed is what videos measure. Agents live in long prompts, where prefill and caching decide most of the wait. My long-prompt benchmark even made the eventual winner look bad, because it measured a shape of prompt my agent never sends.
The video was right, just not about the number. I never saw 200 tokens per second. What I got was the model I had already decided was the better thinker, running 6× faster than before, and that turned out to be the thing that mattered. A week ago I chose speed over correctness because I could not have both. Today I do not have to choose.
References and useful links
- Qwen 3.8 27B Just Hit 200 Token/s on Mac M5 (Lithos Metal): the video that started this.
- lithos-metal and its launch blog post: the engine, megakernels and DSpark integration.
- lithos-metal serving design: how its prefix caching works.
- DSpark: Confidence-Scheduled Speculative Decoding with Semi-Autoregressive Generation: the DeepSeek paper behind the draft model.
- Qwen3.8 27B model card.
- MacBook Pro tech specs: memory bandwidth per chip.
- Ollama and MLX / mlx-lm: the other two engines.
- mflux: Z-Image and Qwen-Image on MLX.
- Qwen-Image-2512 Lightning LoRA: 4- and 8-step distillation.
- opencode: the agent harness used for the Blender task.
This post was written with the help of AI (Claude by Anthropic).